Use the arrows on your navigation panel to move your trends graph forwards, or backwards
- The forward arrow bumps you to future predictions, displaying your projected depletion date
- The backward arrow allows you to view historical data, past fills, and sensor reading start date
Select a time frame you'd like to inspect.
- Choose from available presets: past 1 Day, 1 Week, 1 Month, 3 Months, 6 Months or 1 Year
- Select custom dates from the calendar
- Type in presets such as "this week/month/year" or "last week/month/ year"
- Alternatively, use the magnifying glass icon to zoom out, and extend your interval of time

To narrow and inspect your time frame, highlight a selected area.
- Chart will zoom in to highlighted area to inspect
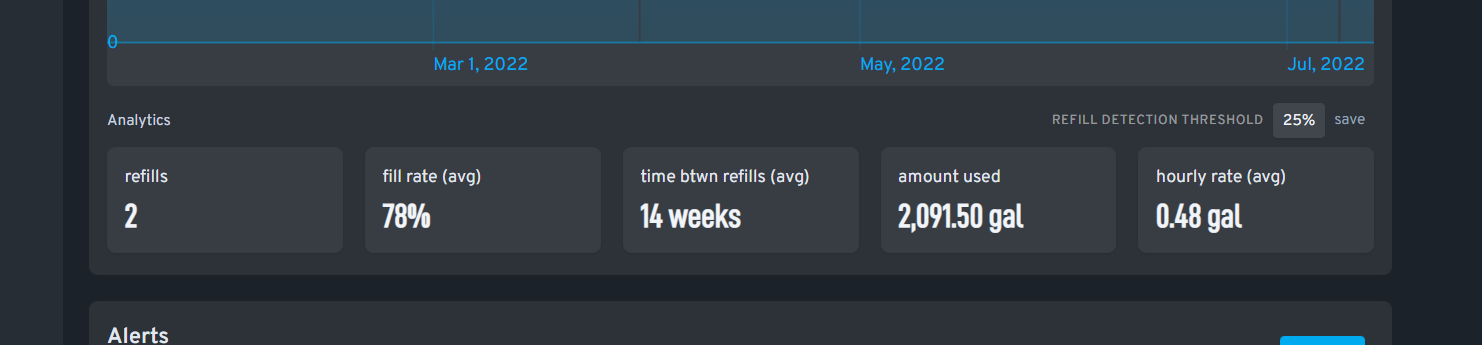
For period shown on the trends graph, product consumed, rate of consumption and amount of refills will be displayed directly below your trends graph.