

Get more from your sensor data with Pulsa Reporting! Our new feature helps you spot problems, improve efficiency, and make smart decisions fast.
Check out the videos in this article for easy steps on how to use it.
How efficient is your business?
Learn the basics of Reporting and how to begin understanding your business on a deeper level. In this video you'll learn:
- Selecting your metrics
- Filtering your data
- Selecting a timeframe
- Sorting your report
Using Goals to track Efficiency
Put you data insights into action using Reporting Goals.
In this video you'll learn how to use Pulsa Report's Goal feature to highlight and track goals within your organization.
- Creating goals
- Comparing goals over time
- Saving and tracking multiple goals
Finding Outliers and Problem Data
Reporting makes it easy to identify outliers through Sorting and Grouping.
Compare sensor measures on assets with similar use cases, tank sizes or route and easily spot items that fall out of the norm.
- Sensors that indicate higher than average usage, or more visits than expected can highlight potential issues like leaks, or sites requiring a larger tank than the current


Analyze Individual Sensor Data on a Deeper Level
Sensor analytics have been given a boost to provide you with more.
Inspect Fill, Usage, and Product History data, all from your Sensor Details page.
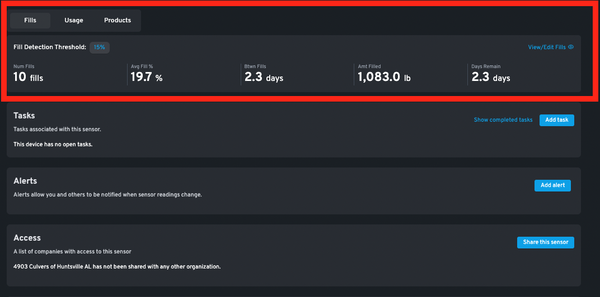
Correcting Inaccurate Data
Clean up data inaccuracies caused by missing periods, site issues or one off incidents.
Pulsa allows you to audit and amend your data to ensure you've always got the most accurate information available.
- Select the "View/ Edit Fills" option available below the sensor trends graph to edit, remove, or add new fill data
